
Hannon Brett | Published on: July 10, 2026 | Time to read: 45 min | Updated on: August 31, 2026
Customer Acquisition Cost (CAC) is the total amount B2B SaaS companies spend on sales and marketing to acquire one new paying customer, and it's a critical metric that directly shapes cash flow, growth speed, and investor perception. The article provides detailed CAC calculation methods, industry benchmarks ranging from $702 for PLG to $11,400 for enterprise sales-led models, and proven strategies like conversion optimization, SEO investment, and referral programs to lower CAC while maintaining a healthy 3:1 LTV:CAC ratio.
Key Takeaways
- CAC is calculated by dividing total sales and marketing spend by new customers acquired in the same period, and should include salaries, tools, ads, events, and overhead (fully-loaded CAC) rather than just paid channel costs
- B2B SaaS CAC benchmarks vary dramatically by go-to-market motion: PLG ($702), Mid-Market Sales-Led ($3,840), and Enterprise Sales-Led ($11,400), with payback periods ranging from 15 months (PLG) to 29 months (sales-led)
- The 3:1 LTV:CAC ratio is the industry sweet spot for profitability. Ratios below 1:1 signal unsustainable unit economics while above 5:1 may indicate underinvestment in growth
- CAC payback period improved from 18 months in 2024 to 16 months in 2025 (11% annual improvement), with top-tier companies recovering acquisition costs in 5-7 months
- Key drivers of CAC include product-market fit, brand strength and organic channel mix, pricing strategy, sales cycle length, and competitive density, not just marketing spend
- The three highest-leverage strategies to lower CAC are: (1) improving conversion at every funnel stage, (2) building SEO and content for long-term organic traffic, and (3) turning existing customers into a growth engine through referrals and expansion revenue
- AI is reshaping acquisition costs through automated ad bidding and lead scoring, with early adopters seeing 15.2% cost reductions and 22.6% productivity gains, though 26% of AI pilots fail due to implementation costs
- Accurate CAC measurement requires clear period alignment, proper cost categorization, and tracking both fully-loaded and paid-only versions to understand true acquisition efficiency versus channel-specific performance
Table of Contents
- What Is Customer Acquisition Cost (CAC) and Why Does It Matter?
- How to Accurately Calculate Your B2B SaaS CAC
- The Definitive B2B SaaS CAC Benchmark Numbers to Know
- Breaking Down CAC Benchmarks by Sales Motion: PLG vs. Sales-Led
- The LTV to CAC Ratio: A Crucial SaaS Benchmark for Viability
- Understanding Your CAC Payback Period Benchmark
- Key Drivers That Influence Your B2B SaaS CAC
- Proven Strategies to Lower Your B2B SaaS CAC
- Embrace the Future: Benchmarking CAC in the Age of AI
- Turn Your CAC Benchmark from a Metric into a Mission
What Is Customer Acquisition Cost (CAC) and Why Does It Matter?
Customer Acquisition Cost (CAC) is the total amount a B2B SaaS company spends on sales and marketing to win one new paying customer. It covers everything from ad spend and sales salaries to software tools and events. Knowing your CAC is the starting point for any honest conversation about growth, profitability, and whether your business model actually works. Once you know what a customer costs, the next question is what to spend in total, and our breakdown of the SaaS marketing budget by funding stage puts real percentages and dollar ranges against Seed, Series A and Series B.
The Simple CAC Formula
CAC is calculated by dividing your total sales and marketing spend over a given period by the number of new customers you brought in during that same period. If you spent $100,000 last quarter and closed 50 new customers, your CAC is $2,000 per customer. Simple in concept, but easy to miscalculate if you leave out hidden costs.
Why B2B SaaS Teams Track CAC So Closely
For B2B SaaS companies, CAC sits at the center of nearly every financial decision. It directly shapes your cash flow, your fundraising conversations, and how fast you can grow. Investors look at CAC alongside payback period and lifetime value to judge whether a company is spending wisely or burning cash without a clear return.
According to Stripe's SaaS resource center, CAC is one of the most closely watched unit economics metrics because it connects directly to how long a company can sustain growth before needing outside capital.
CAC vs. CPA: They Are Not the Same
A common mix-up is treating CAC and Cost Per Acquisition (CPA) as the same thing. They are not.
CPA measures the cost to generate any conversion, like a free trial sign-up, a demo request, or a form fill. CAC measures the cost to acquire a customer who actually pays you money. In B2B SaaS, where free trials and demos are common, the gap between CPA and CAC can be significant. Focusing only on CPA can make your marketing look far more efficient than it really is.
Tracking true CAC keeps you honest about what it actually costs to grow revenue, not just to fill a pipeline.
How to Accurately Calculate Your B2B SaaS CAC
Getting your CAC number right starts with knowing exactly what goes into it. The standard formula is simple: divide your total sales and marketing costs by the number of new customers you acquired in the same period. But the real work is making sure you're counting everything that should be in that numerator.
The Core CAC Formula
CAC = Total Sales & Marketing Costs ÷ Number of New Customers Acquired
The period you choose matters. Most teams calculate CAC monthly or quarterly. Just make sure your spend and your new customers are from the same window of time. Mixing a full year of spend with one quarter of customers will give you a broken number.
What Costs to Include (And What to Leave Out)
This is where most teams get it wrong. A lot of costs get overlooked, which makes CAC look cheaper than it really is.
Include these costs:- Sales team salaries, bonuses, and commissions
- Marketing team salaries and contractor fees
- Paid advertising spend (search, social, display)
- Marketing software and sales tools (CRM, automation platforms)
- Content production and design costs
- Events, trade shows, and sponsorships
- Overhead costs tied to sales and marketing (office space, benefits)
- Customer success team salaries
- Onboarding and implementation costs
- Support team expenses
- Product development costs
Customer success costs belong in a different bucket. They're about keeping customers, not winning them. Mixing them into CAC inflates the number and blurs what you're actually spending on acquisition.
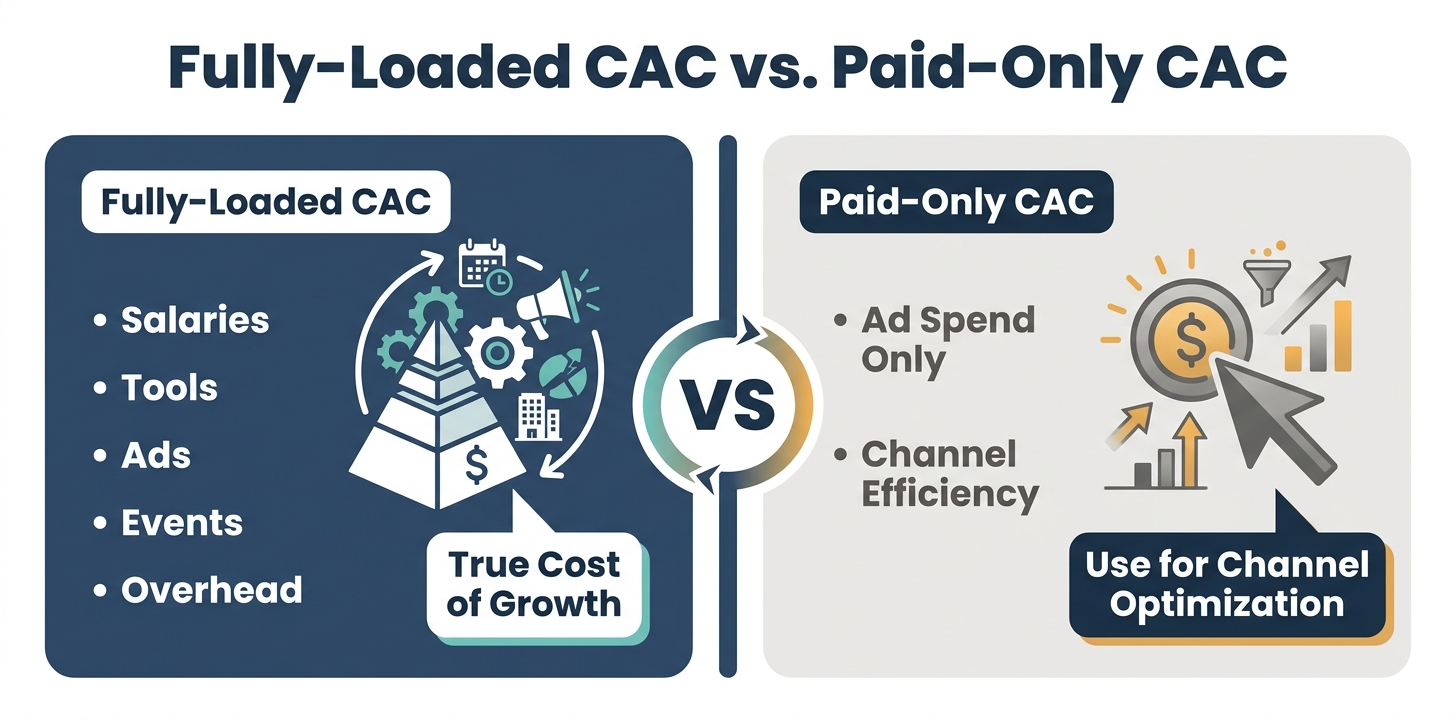
Fully-Loaded CAC vs. Paid-Only CAC
There are two ways most B2B SaaS teams calculate CAC, and both have a place in your reporting.
Fully-loaded CAC includes every cost connected to acquiring a customer: salaries, tools, ads, events, overhead. This is the honest number. It shows what growth actually costs your business and is the version investors will ask for.Paid-only CAC counts just your direct paid channel spend, like ad budgets. It's useful for comparing channel efficiency or optimizing a specific campaign. But it will always look better than your true CAC because it ignores people costs.The risk of only tracking paid CAC is that it can make your marketing look highly efficient while your fully-loaded number is quietly climbing. According to data from First Page Sage's 2024 B2B SaaS CAC report, organic CAC averages around $942 while paid CAC averages $1,907, a gap that only shows up when you track both versions.
Use fully-loaded CAC for financial planning and investor reporting. Use paid-only CAC for channel-level decisions. Knowing both gives you a clearer picture of where your growth dollars are actually going.
The Definitive B2B SaaS CAC Benchmark Numbers to Know
 The average B2B SaaS CAC benchmark ranges from $702 for self-serve models to $11,400 for enterprise sales-led companies, with a blended CAC ratio of $1.61 per $1 of new ARR as of 2023. These numbers vary widely by go-to-market motion, industry, and customer segment, and we've mapped how they shift at each funding stage in a dedicated benchmark guide.
Overall Benchmark Ranges for 2023 and 2024
CAC has been climbing. According to Benchmarkit's 2024 SaaS Performance Metrics report, the blended CAC ratio jumped 22% from $1.32 per $1 of ARR in 2022 to $1.61 in 2023. The median new name CAC ratio held at $1.76, while bottom-quartile performers reached $2.82.
That rise reflects real pressure. Ad costs are up, sales cycles are longer, and buyers are more cautious. So if your CAC has gone up recently, you're not alone.
CAC payback has also stretched. The median payback period for companies doing $5M to $50M ARR reached about 18 months, up from 12 to 15 months just a couple of years prior, per High Alpha's 2025 SaaS Benchmarks.
CAC Benchmarks by Go-to-Market Motion
Your sales model shapes your CAC more than almost anything else. Here's what the data shows:
| Go-to-Market Motion | Median CAC | Year-over-Year Trend |
|---|---|---|
| Self-Serve / PLG | $702 | +2% YoY |
| Mid-Market Sales-Led | $3,840 | +6% YoY |
| Enterprise Sales-Led | $11,400 | +9% YoY |
Product-led growth keeps CAC low because the product does the selling. Enterprise sales-led models cost far more due to long sales cycles, large teams, and multi-stakeholder decisions. According to research from Gripped on SaaS CAC by industry, the gap between PLG and enterprise sales-led can be 16x or more.
CAC Benchmarks by Customer Segment (ACV)
Higher-value customers cost more to acquire. That's expected. But the ratio of CAC to lifetime value is what actually matters.
| Segment | ACV Range | CAC Range | Payback Target |
|---|---|---|---|
| SMB | Under $15K | $321 to $1,461 | Under 12 months |
| Mid-Market | $15K to $100K | $1,407 to $5,330 | Under 18 months |
| Enterprise | Over $100K | $2,206 to $14,774 | Under 24 months |
Enterprise CAC looks scary until you see the lifetime value. A customer worth $300K to $1M+ can easily justify a $10K to $14K acquisition cost, as long as churn stays low.
CAC Benchmarks by Industry
Industry context matters a lot here. Compliance requirements, technical complexity, and buyer risk tolerance all push CAC up or down.
| Industry | Typical CAC Range | Enterprise CAC | Key Driver |
|---|---|---|---|
| HR Tech | $410 to $1,200 | Up to $6,793 | Mid-tier evaluation cycles, free trials common |
| Cybersecurity | $805 to $1,800 | Up to $10,226 | CISO involvement, technical complexity |
| Fintech | $1,450 and above | Up to $14,774 | Compliance requirements, risk-averse buyers |
Fintech and cybersecurity carry the highest acquisition costs because buyers move slowly and carefully. HR Tech sits in the middle, where free trials and shorter cycles help keep costs more manageable.
These numbers give you a real-world baseline. If your CAC falls within your segment and industry range, you're in normal territory. If it's climbing above those upper bounds, that's a signal worth investigating.
Breaking Down CAC Benchmarks by Sales Motion: PLG vs. Sales-Led
Your go-to-market motion is the single biggest driver of your CAC. Product-Led Growth (PLG) companies typically see CAC in the range of $50 to $500 per customer. Traditional sales-led companies often pay $500 to $5,000 or more. That gap exists because the mechanics of how you acquire customers are completely different.
Why PLG Keeps CAC So Low
In a PLG model, the product does most of the selling. Users sign up, try the product, and convert without ever talking to a sales rep. There's no big sales team to pay, no long negotiation cycle, and no expensive outbound campaigns for every single prospect.
This self-serve structure means your acquisition engine runs at a fraction of the cost. Users discover the product through word of mouth, organic search, or community. They onboard themselves. And they often invite colleagues, which creates a built-in viral loop that keeps CAC low over time.
Why Sales-Led Models Cost More
Sales-led growth flips that equation. To close a deal, you need sales development reps, account executives, demos, proposals, and sometimes months of back-and-forth with multiple stakeholders. All of that human effort adds up fast.
According to research from Product Led, PLG strategies can reduce acquisition costs by 50% to 80% compared to traditional sales-led approaches. That's a massive difference in unit economics, especially as you scale.
But here's the important context: sales-led models justify their higher CAC through larger deal sizes. A $25,000+ annual contract with a multi-year commitment can easily absorb a $3,000 to $10,000 acquisition cost and still produce a healthy LTV:CAC ratio.
CAC Payback: Where the Gap Gets Even Clearer
The CAC difference between PLG and sales-led shows up clearly in payback periods too. PLG companies report a median payback of around 15 months. Sales-led companies often see payback periods closer to 29 months, according to data from Bantrr's SaaS CAC payback benchmarks.
That's nearly double the time to recover your acquisition investment. For cash-strapped growth-stage companies, a 29-month payback creates real pressure on runway and fundraising timelines.
Choosing the Right Motion for Your Product
The best motion depends on your product's complexity and your average contract value.
- PLG works best when your ACV is under $10,000 and users can adopt the product without training or hand-holding.
- Sales-led works best when your ACV is above $25,000 and you're selling to buying committees that need human negotiation and custom scoping.
Neither motion is universally better. But understanding where your CAC falls relative to your motion helps you know if you're efficient or if something's broken in your acquisition engine.
The LTV to CAC Ratio: A Crucial SaaS Benchmark for Viability
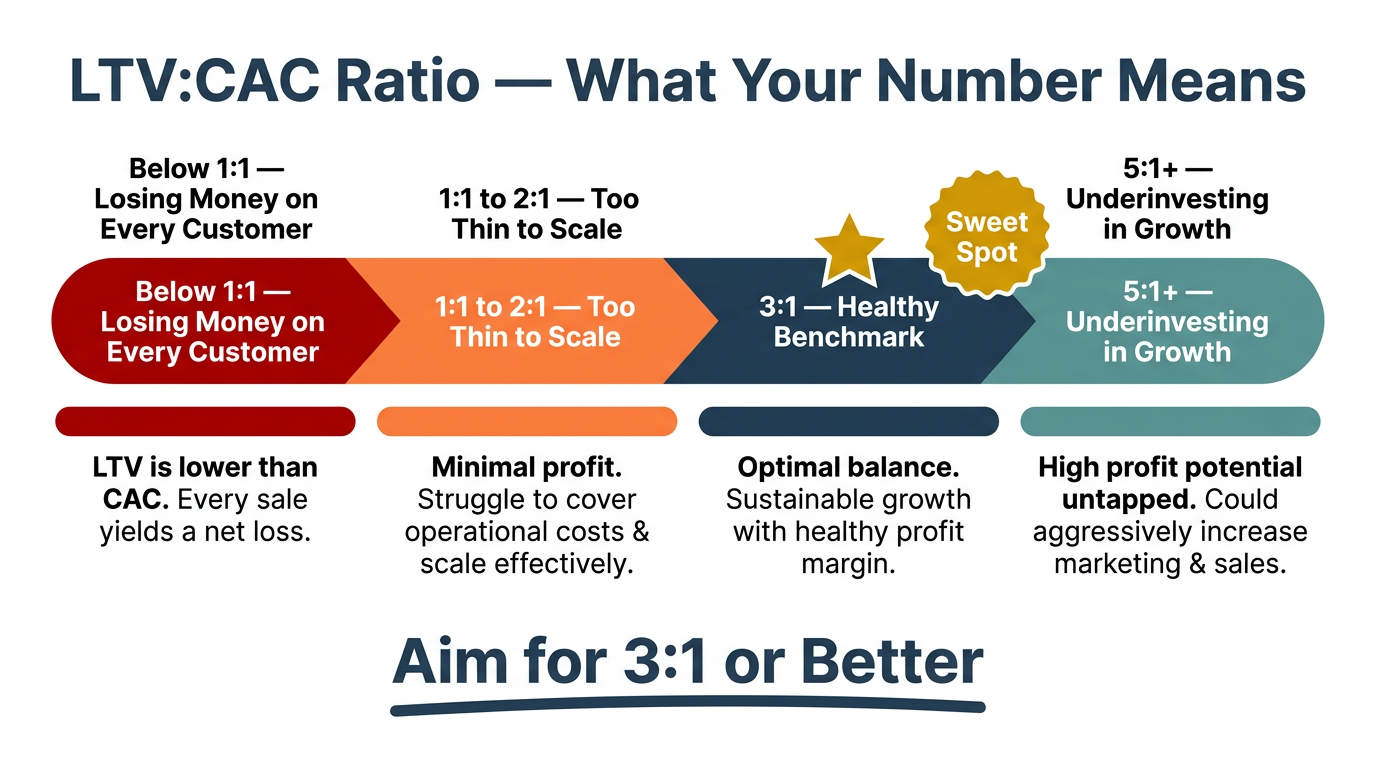
The LTV to CAC ratio tells you how much value a customer generates compared to what it cost to win them. A ratio of 3:1 is the widely accepted healthy benchmark for B2B SaaS. Below 1:1 means you're losing money on every customer. Above 5:1 often signals you're underinvesting in growth.
What LTV Actually Means
Customer Lifetime Value (LTV) is the total gross profit a customer generates over their entire relationship with your company. The simplest way to calculate it is to divide your Average Revenue Per Account (ARPA) by your churn rate, then multiply by your gross margin.
For example, if a customer pays $12,000 per year and you have a 15% annual churn rate, your LTV is $80,000. According to ChartMogul's SaaS metrics guide, using gross profit rather than raw revenue is key because it reflects the actual value you keep, not just what you bill.
The 3:1 Rule and What It Signals
David Skok of Matrix Partners, one of the most cited voices on SaaS unit economics, has long argued that 3:1 is the sweet spot. At that ratio, you're generating enough margin from customers to cover acquisition costs and still reinvest in growth.
Here's how to read the ratio:
| LTV:CAC Ratio | What It Means |
|---|---|
| Below 1:1 | You're spending more to acquire than customers will ever return |
| 1:1 to 2:1 | Technically profitable but margins are too thin to scale |
| 3:1 | Healthy. This is the benchmark most investors use |
| 5:1 or higher | Strong unit economics, but you may be leaving growth on the table |
A ratio above 5:1 sounds great, but it can actually be a warning sign. It often means you're being too conservative with acquisition spend, letting competitors grab market share while you sit on a cash cushion.
Why Investors Watch This More Than CAC Alone
CAC by itself doesn't tell investors much. A $10,000 CAC looks awful until you learn the customer is worth $60,000 over their lifetime. That's a 6:1 ratio, and suddenly the math works.
According to Burkland Associates' breakdown of SaaS unit economics, the LTV:CAC ratio is one of the clearest signals of whether a business model is sustainable at scale. It shows that growth spending is disciplined and that the business earns back more than it spends.
For early-stage companies, investors often care more about the trend in this ratio than the absolute number. If your LTV:CAC is improving quarter over quarter, that's a strong indicator your go-to-market motion is maturing the right way.
Understanding Your CAC Payback Period Benchmark
The CAC payback period is the number of months it takes to earn back what you spent to acquire a customer. The standard B2B SaaS benchmark is under 12 months, with top-performing companies hitting 5 to 7 months. A shorter payback period means faster cash recovery and more fuel to reinvest in growth.
What the CAC Payback Period Actually Measures
Think of it this way: if you spend $3,000 to win a customer and that customer pays you $250 per month in gross profit, your payback period is 12 months. Once you cross that line, every dollar that comes in is contributing to real profit rather than just recovering your investment.
The formula is straightforward: divide your CAC by the monthly recurring revenue per customer, then multiply by your gross margin percentage. That gives you the true payback in months, not just a revenue estimate that ignores what it actually costs you to deliver the service.
What the Benchmarks Show
According to ScaleXP's 2025 SaaS benchmark analysis, the median CAC payback period improved from 18 months in 2024 to around 16 months in 2025. That 11% improvement in a single year is the largest gain in four years, which is an encouraging sign after several years of rising costs.
But the range still varies a lot by segment:
| Segment | Typical Payback Target | Top-Quartile Performance |
|---|---|---|
| SMB (ACV under $15K) | Under 12 months | 5 to 6 months |
| Mid-Market ($15K to $100K ACV) | Under 18 months | 7 months |
| Enterprise (Over $100K ACV) | Under 24 months | 9 months |
Top-tier companies across all segments often recover their acquisition cost in well under a year. That's a significant competitive advantage because it frees up capital much faster than peers who are still waiting 20 or 24 months to break even on a customer.
Why a Shorter Payback Period Changes Everything
A payback period over 18 months creates real pressure on your business. You're constantly funding new customer acquisition before previous customers have paid back their acquisition cost. That gap has to come from somewhere, usually venture funding or debt.
When you shorten your payback period, a few things happen at once. Your cash position improves. You need less outside capital to sustain the same growth rate. And you can reinvest in sales and marketing faster, which compounds your growth without burning through reserves.
According to Optif's CAC payback period benchmark guide, venture-backed B2B SaaS companies typically target under 18 months, while bootstrapped companies often aim for under 12 months to stay self-funded. A payback period above 24 months is generally considered a warning signal that something in your go-to-market motion needs attention.
The Two Levers That Shorten Payback Period
You can improve your payback period by pulling on either side of the equation.
Reduce CAC: Tighten your channel mix, improve conversion rates, or shift more acquisition toward organic and referral sources. Organic acquisition typically costs far less than paid, and that gap compounds over time.Increase monthly gross profit per customer: This means either raising prices, reducing cost of goods sold, or moving upmarket toward higher-ACV contracts. A customer paying $1,000 per month at 80% gross margin recovers your acquisition cost in half the time compared to one paying $500 per month at the same margin.The fastest-growing B2B SaaS companies tend to work both levers at the same time rather than treating payback period as a fixed constraint.
Key Drivers That Influence Your B2B SaaS CAC
Your B2B SaaS CAC benchmark isn't just a number that appears on a spreadsheet. It's the result of dozens of interconnected decisions across your product, marketing, sales, and pricing strategy. Understanding what actually moves that number helps you act on it rather than just report it.
Product-Market Fit Changes Everything
When your product solves a real, urgent problem for a clearly defined audience, acquisition gets easier and cheaper. Buyers recognize the value quickly. Sales cycles shorten. Word of mouth kicks in.
Weak product-market fit has the opposite effect. You spend more time convincing people they have a problem, more money on nurture campaigns, and more hours on demos that don't close. All of that shows up as a higher CAC.
According to research from Omnibound on B2B SaaS marketing statistics, companies with strong product-market fit generate significantly more organic traffic and referral leads, two channels that consistently produce lower acquisition costs than outbound or paid.
Brand Strength and Organic vs. Paid Channel Mix
Your channel mix is one of the biggest levers in your CAC. Companies that rely heavily on paid ads face a structural disadvantage. Ad costs on LinkedIn rose 24% and Google rose 19% between 2023 and 2024, directly inflating CAC for companies without strong organic foundations.
Brands that invest in content, SEO, and thought leadership build a lower-cost acquisition engine over time. Organic channels convert at roughly 2x the rate of paid channels and cost about 40% less per acquired customer.
The data is clear: companies where organic search sources 25% or more of pipeline consistently carry a lower blended CAC than peers who rely on paid to fill the top of funnel. That gap compounds as the brand grows stronger.
Pricing Strategy and Average Contract Value
Your pricing structure directly shapes your CAC math. A higher ACV means you can afford to spend more on acquisition while still hitting a healthy LTV to CAC ratio. But it also tends to lengthen sales cycles, which adds cost.
Lower-priced, self-serve products keep CAC low by removing the human element from the buying process. But they require volume to generate meaningful revenue, and that volume requires its own acquisition investment.
The key is alignment between price point and channel strategy. A $500 per year product can't absorb a $3,000 acquisition cost. A $50,000 per year contract can, as long as churn stays low.
Sales Cycle Length and Complexity
Longer sales cycles are expensive. Every extra week a deal spends in the pipeline means more sales rep time, more follow-up emails, more demo calls, and more manager involvement. That time has a real cost that flows directly into your CAC.
Enterprise deals routinely take six to twelve months to close. During that time, you're paying salaries, running targeted campaigns, and hosting in-person events, all before a single dollar of revenue comes in.
According to Maxio's 2025 SaaS Benchmarks Report, companies with average sales cycles under 30 days report CAC payback periods that are roughly half those of companies with cycles exceeding 90 days. Cycle length and CAC move together almost every time.
Competitive Density in Your Category
The more crowded your category, the harder and more expensive it is to win attention and trust. Buyers in competitive markets do more research, evaluate more vendors, and take longer to decide.
That dynamic forces teams to spend more on content, events, reviews, and comparison pages just to stay visible. And when everyone is running paid ads to the same audience, bid prices go up and conversion rates go down.
This is why two SaaS companies with identical products can have very different CAC numbers. The one operating in a less competitive niche often wins on unit economics simply because acquisition friction is lower.
Critical Questions to Ask About Your CAC
- Are you calculating fully-loaded CAC (including salaries, overhead, tools) or only paid channel costs? If only paid, you're likely underestimating your true acquisition cost by 30-50%.
- What is your current LTV:CAC ratio, and does it meet the 3:1 healthy benchmark? If below 1:1, your business model is losing money on every customer acquisition.
- How does your CAC payback period compare to your go-to-market motion benchmark (PLG ~15 months vs. Sales-Led ~29 months)? Are you significantly above your segment target?
- What percentage of your new customers come from organic vs. paid channels? If organic is below 25% of pipeline, you're likely overpaying for growth and missing long-term efficiency gains.
- Which of the three leverage points (conversion optimization, organic channel building, or referral/expansion programs) would have the highest impact on your CAC given your current metrics?
Proven Strategies to Lower Your B2B SaaS CAC

The fastest way to improve your b2b saas cac benchmark position is to work on three things at once: convert more of the traffic you already have, build acquisition channels that get cheaper over time, and turn your existing customers into a growth engine. None of these require a bigger budget. They require smarter use of what you already have. (If you're not sure what the right budget even is for your stage, start with our SaaS marketing budget benchmarks by funding stage.)
Convert More at Every Stage of the Funnel
Conversion Rate Optimization (CRO) is one of the highest-leverage moves you can make, especially once you know where typical B2B SaaS funnels convert at each stage. If your website converts at 1% and you double that to 2%, you just cut your CAC in half without spending an extra dollar on traffic.
CRO applies at every stage. On your website, that means clearer messaging, faster load times, and stronger calls to action. In your sales process, it means better discovery calls, tighter follow-up sequences, and sharper demo scripts. Every improvement compounds across your entire acquisition funnel.
According to Digital Applied's 2026 CAC benchmarks analysis, companies that actively optimize conversion rates at each funnel stage report meaningfully lower blended CAC compared to peers who focus only on top-of-funnel volume. More traffic with a leaky funnel just means more wasted spend.
Build SEO and Content for Long-Term, Lower-Cost Traffic
Paid ads deliver traffic today but stop the moment you stop spending. SEO and content marketing work the opposite way. The investment you make today keeps generating traffic and leads for months or years afterward.
Organic search converts at roughly double the rate of paid channels and costs about 40% less per acquired customer. Companies where organic sources drive 25% or more of pipeline consistently carry a lower blended CAC than peers who rely on paid to fill their funnel.
B2B SaaS companies that publish consistently and invest in technical SEO can generate a compounding return on that content over time. According to data from Click Vision's SaaS SEO statistics report, B2B SaaS companies generate a 702% ROI from SEO with a break-even time of around seven months. That kind of return is nearly impossible to replicate with paid ads alone.
The key is consistency. Companies publishing nine or more blog posts monthly see organic traffic increases of nearly 36%, which directly translates into more pipeline at a lower cost per lead.
Use Referrals and Expansion Revenue to Offset Acquisition Costs
Referral programs are one of the most underused levers in B2B SaaS. Referred customers cost far less to acquire, convert faster, and retain longer. According to SaaS Hero's LTV and CAC benchmarks guide, referral programs yield an average CAC of around $150, compared to $1,980 for outbound sales. That's a dramatic difference in unit economics.
And expansion revenue takes this even further. When existing customers upgrade to higher tiers, add seats, or buy additional products, the revenue you earn carries no acquisition cost at all. If your expansion revenue exceeds your churn, your net CAC on the existing base becomes negative.
This is why net revenue retention is such a powerful metric. A company with strong expansion doesn't just lower its effective CAC. It creates a growth engine inside its existing customer base that requires no new acquisition spend to run.
Focusing on all three of these levers at once, better conversion, lower-cost organic traffic, and referral plus expansion growth, is how the most efficient B2B SaaS companies consistently outperform their CAC benchmarks without simply outspending the competition.
Worked Example: Improving Payback Period Through Multiple Levers
Consider a B2B SaaS company targeting mid-market customers with a CAC of $3,000 and monthly recurring revenue per customer of $250 at 75% gross margin. The margin-adjusted revenue is $250 x 0.75 = $187.50 per month, so the payback period is $3,000 / $187.50 = 16 months. Now pull two levers at once. A conversion-rate pass across the site and sales process trims CAC from $3,000 to $2,400. An expansion push lifts average MRR from $250 to $300, which is $300 x 0.75 = $225 of margin-adjusted revenue. The new payback period is $2,400 / $225 = 10.7 months. Neither lever alone gets this company under 12 months, but together they turn a worrying payback number into a healthy one. That's why the levers above work best in combination.
Embrace the Future: Benchmarking CAC in the Age of AI
AI is actively reshaping how B2B SaaS companies acquire customers and what that acquisition actually costs. From automated ad bidding to AI-generated content and predictive lead scoring, the tools have changed. And that means the cost structures behind your b2b saas cac benchmark are changing too.
AI Is Shifting the Cost Structure of Acquisition
Generative AI adoption among marketers jumped from 21% in 2022 to 74% in 2023, according to Sequencr's analysis of generative AI statistics. Early adopters reported an average 15.2% reduction in costs and a 22.6% gain in productivity. That's a real impact on CAC for teams using AI well.
AI-powered ad bidding reduces wasted spend by optimizing in real time. AI lead scoring helps sales teams focus on prospects most likely to convert, which shortens cycles and lowers cost per closed deal. Content creation that once took weeks now takes hours.
But it's not a free lunch. Enterprise AI spending surged past $13.8 billion in 2024. And 26% of AI pilots failed because of unexpected implementation costs. The efficiency gains are real, but they require thoughtful execution to show up in your CAC numbers.
That execution gap is the entire premise of The Zulu Method's AI-native model: a small senior team directing AI systems across 10+ channels to choose from, instead of a headcount-heavy team where every added channel means another salary in your CAC. If you want to see what that does to the math, the cost calculator compares the fully loaded numbers side by side.
The Zero-Click Search Problem
One growing pressure on content-driven CAC models is the rise of zero-click searches. AI-generated answer boxes in search results mean more users get their questions answered without ever clicking through to your site. That changes the math on SEO-driven acquisition.
Companies that built their low-CAC models on organic traffic need to adapt. The answer isn't to abandon content. It's to create content that goes deeper than what an AI summary can replicate: original research, proprietary data, and expert perspectives that give readers a reason to click. We track this shift closely at The Zulu Method, and we've published our own AI search conversion rate benchmarks plus a breakdown of how AI search optimization works as a channel.
How to Adapt Your CAC Measurement Strategy
As AI reshapes acquisition channels, the way you measure CAC needs to keep pace. A few shifts worth making now:
- Track AI tool costs as part of your fully-loaded CAC, not as a separate IT expense
- Monitor channel performance more frequently, since AI-optimized channels can shift faster than traditional ones
- Test content formats that drive clicks rather than just impressions, since zero-click trends reward depth over volume
The b2b saas cac benchmark numbers from 2023 and 2024 were shaped by a specific cost environment. AI is starting to change that environment. Companies that adapt their measurement and strategy now will be better positioned to lower CAC as these tools mature.
Turn Your CAC Benchmark from a Metric into a Mission
Knowing your b2b saas cac benchmark is only useful if you act on it. The numbers in this guide give you a clear target: aim for an LTV:CAC ratio of 3:1 or better, and work toward a payback period under 12 months. Those are not arbitrary goals. They are the thresholds that separate companies building sustainable growth from those quietly burning through capital.
But benchmarks are guides, not rules. A 20-month payback period isn't a death sentence if your churn is low and your expansion revenue is strong. What matters more than hitting a specific number is whether your unit economics are moving in the right direction quarter over quarter.
Here's your action plan for this quarter:
- Calculate your fully-loaded CAC today, including salaries, tools, ad spend, and overhead. Not just your paid channel costs.
- Compare it to the benchmarks for your go-to-market motion, customer segment, and industry from this guide.
- Pick one strategy from this article and start testing it now. Whether that's improving funnel conversion, launching a referral program, or investing in organic content, one focused improvement compounds fast.
According to Baremetrics' guide on CAC payback period, the companies that improve their unit economics fastest are the ones that measure accurately, benchmark honestly, and act consistently. Not the ones with the biggest budgets.
Your CAC benchmark tells you where you stand. What you do with that information determines where you go.

B2B SaaS CAC FAQs
What is a good LTV to CAC ratio for B2B SaaS?
A good LTV to CAC ratio is generally considered to be 3:1 or higher, which indicates a profitable customer acquisition model. A ratio below 1:1 means you're breaking even on each customer (unsustainable), while 5:1 or higher is excellent but may suggest you're underinvesting in growth opportunities.
How do you calculate CAC for a SaaS business?
To calculate CAC, sum all sales and marketing expenses over a specific period (e.g., quarter) and divide by the number of new customers acquired in that same period. Fully-loaded expenses should include salaries, bonuses, ad spend, software tools, commissions, and relevant overhead, not just paid channel costs.
What's the average CAC for a SaaS company?
There's no single average because CAC varies wildly by industry, ACV, and business model. However, benchmarks range from $702 for self-serve PLG models to over $11,400 for enterprise sales-led companies, with most B2B SaaS falling between $1,200 and $5,000.
What should be included in CAC calculations?
Fully-loaded CAC should include all marketing and sales salaries, bonuses and commissions, advertising spend, marketing and sales software costs, content production expenses, event costs, and related overhead. Exclude customer success, onboarding, support, and product development costs. These belong in different metrics.
Why is my SaaS CAC so high?
High CAC can result from inefficient ad spend, long sales cycles, low conversion rates on your website, weak product-market fit, or targeting the wrong customer segment. Analyze your entire acquisition funnel to identify bottlenecks, and compare your CAC to your specific industry and go-to-market motion benchmarks.
How does channel mix affect the B2B SaaS CAC benchmark?
Your channel mix is a primary driver of blended CAC. Heavy reliance on paid channels like LinkedIn or Google Search inflates CAC, while a strong organic engine built on SEO and content marketing significantly lowers blended CAC over time. Organic channels convert at roughly 2x the rate of paid and cost about 40% less per customer.
When should an early-stage startup start tracking CAC?
Startups should begin tracking CAC as soon as they have a repeatable customer acquisition process, even if pre-product-market fit. Early CAC will be high and volatile, but post-PMF, accurate CAC tracking and optimization should become a primary focus for founders and marketing teams to validate sustainable unit economics.